The Meaning & Connection Map: A Visual Encyclopedia of Ideas
On this page
What is this?
The Meaning & Connection Map is a full-screen, interactive concept graph built for desktop. It maps more than 50 ideas — from fundamental concepts like probability, feedback loops, and emergence to applied domains like large language models, data pipelines, and hypothesis testing — connected by over 100 explicitly explained relationships.
It is designed for a curious person who has zero specialist background. Every node has a plain-English explanation, a concrete everyday example, and a note on why the concept matters. Every edge explains how and why the two concepts are related — not just that they are.
How to use it
- Pan by dragging anywhere on the canvas
- Zoom with your scroll wheel or trackpad
- Click any node to open its full explanation on the right panel — what it means, what it’s made of, and how it connects to everything else
- Use the category filters at the top to focus on a specific domain: Foundations, AI/ML, Data Engineering, etc.
- Search for a specific concept using the search box
Why this exists
Interviews, curious conversations, and self-study all share a common problem: a person encounters a term — “vector embeddings,” “RAG,” “feedback loops” — and has no intuitive grasp of what it really means. They get definitions that use other undefined terms. They are told that two things are connected but not why.
This map is an attempt to break that cycle. Every explanation is written in ordinary language, with analogies and examples. Every relationship is accompanied by a one-sentence explanation of the connection.
The map deliberately mixes foundational concepts (probability, causality, abstraction) with applied ones (large language models, ETL pipelines, containerization) because real understanding comes from seeing how the same principles — optimization, trade-offs, feedback loops — show up across domains that seem unrelated.
Technical approach
The visualization is built with D3.js for force-directed graph layout and Svelte 5 for the reactive detail panel. It runs entirely in the browser with no backend dependency. The force simulation computes node positions so connected concepts settle near each other, forming natural conceptual clusters.
The graph is designed to grow. The data model supports adding more nodes and edges without changing the rendering code.
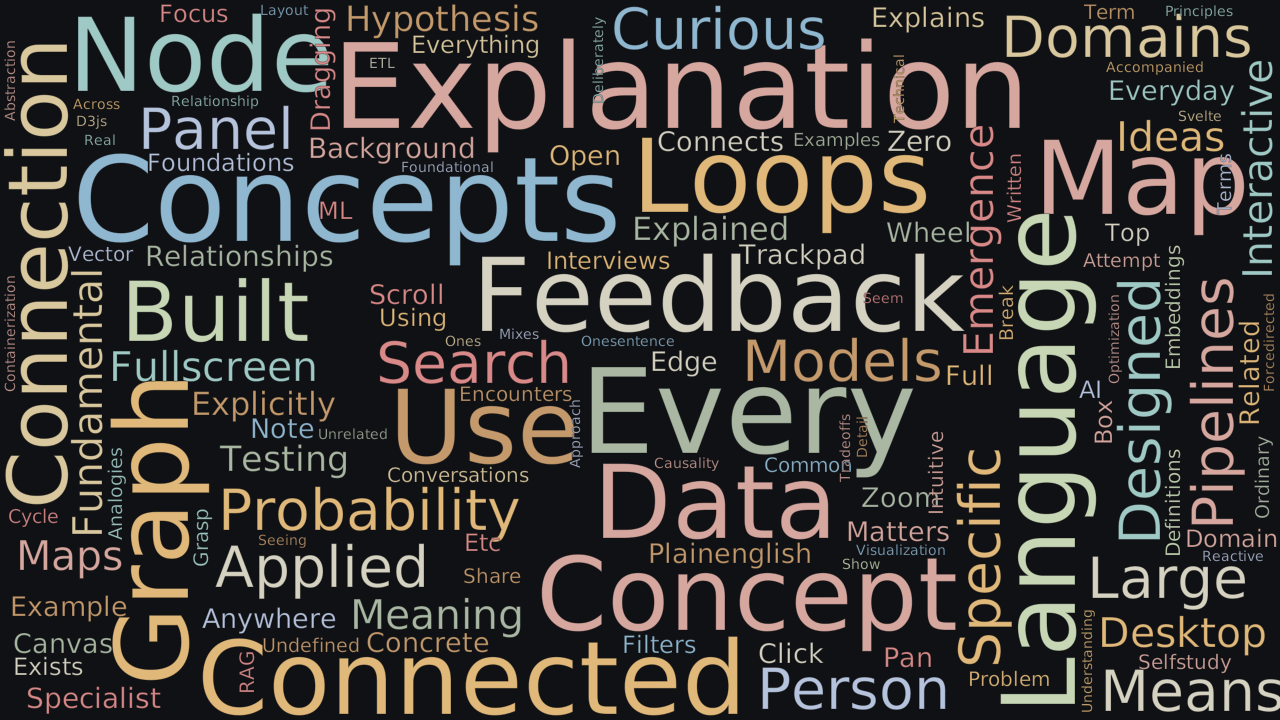
Word Cloud
Related reading
Selected by shared topics and section, with closer publication dates breaking ties.