Before You Had a Heartbeat, You Were a Rhythm
On this page
Quick Answer
When sperm and egg fuse, calcium stored inside the egg is released in a wave or a train of pulses. That temporary signal helps the egg complete meiosis, resist additional sperm, form pronuclei, and enter its first cell cycle. Different animals encode the transition with strikingly different timings.
Key Terms
- Cytosolic calcium
- Egg activation
- Calcium transient
- PLC zeta
- Inositol trisphosphate
- IP3 receptor
- Endoplasmic reticulum
- Cortical granule
- Meiotic arrest
- Pronucleus
Frequently asked questions
Does a fertilized egg really flash?
No. Researchers use calcium-sensitive fluorescent dyes, photoproteins such as aequorin, or electrodes. Instruments convert changes in intracellular calcium into brightness, ratios, or electrical readings; the egg does not emit a visible flash unaided.
Is calcium the first event of fertilization?
No. Sperm binding and membrane fusion precede the calcium response, and some species also show rapid electrical changes. The calcium rise is one of the earliest decisive intracellular signals in the egg, not the literal first event.
Do all fertilized eggs oscillate?
No. Mammalian eggs commonly show repeated transients, ascidians can produce rapid pulse trains, and Xenopus and Lytechinus eggs provide well-studied examples of a single propagating wave.
What starts calcium oscillations in a mammalian egg?
After gamete fusion, sperm-derived PLC zeta promotes production of IP3 from PIP2. IP3 opens IP3R1 channels on the egg's endoplasmic reticulum, releasing stored calcium. Feedback, channel gating, clearance, resequestration, influx, and store recovery shape the repeated signal.
Is this the master clock that shapes the embryo?
No. Fertilization-associated calcium is a temporary activation programme that usually ends around pronuclear formation. Segmentation clocks, later calcium events, ERK waves, and morphogenetic oscillators are distinct systems.
The calcium signals that wake an egg
The microscopy room is dark because darkness makes a small change easier to see. On a monitor sits one egg, a pale circle against black. A sperm reaches it. For a few seconds, nothing in the image seems to happen. Then a bright region appears near one edge and advances across the cell. The whole egg glows; the signal fades. In a mammalian egg, another rise may follow minutes later, and another after that.
The egg has not become a lamp. Its interior has changed, and an instrument has translated that change into light.
Before the embryo divides once—before it has a heart, nerves or even two cells—the egg’s interior undergoes a precisely timed calcium signal. It is not literally the first event of fertilization: sperm binding and membrane fusion come before it, and some animals also make fast electrical responses. But it is among the earliest decisive changes inside the egg, the point at which contact between two cells becomes a sustained programme of egg activation.
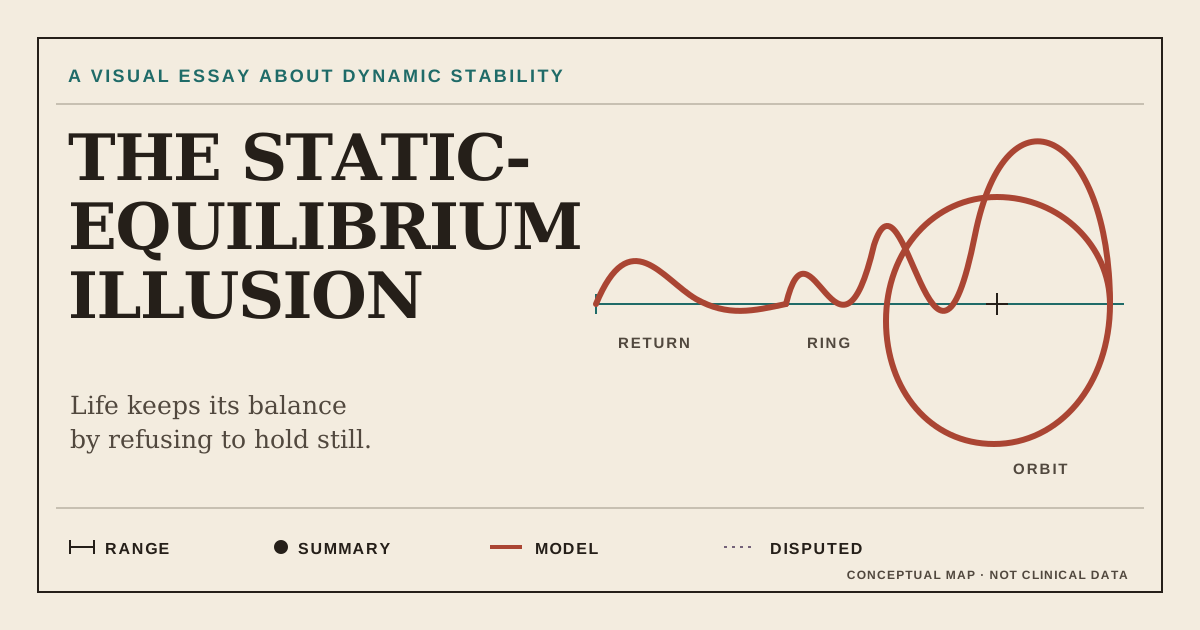
Fertilization does not begin development with a blueprint being read from top to bottom. It begins with a change in time: calcium rises, falls and—in mammals—rises again.
The conceptual prompt for this essay came from Alan Garfinkel’s Newton Abraham Lecture. Its factual claims and numerical values, however, come from the linked experiments and scholarly reviews.
What the viewer is actually seeing
Calcium ions are everywhere in biology, but their location matters. An unfertilized egg keeps the concentration of free calcium in its cytosol—the watery interior outside membrane-bound compartments—relatively low. Much more is held in stores, especially the endoplasmic reticulum, a folded network of internal membrane. Opening channels in that membrane briefly releases calcium into the cytosol. Pumps, exchangers and binding proteins then help lower it again.
Researchers can follow this change with a calcium-sensitive fluorescent indicator whose light changes when it binds calcium. Some classic studies used aequorin, a calcium-sensitive photoprotein measured by a photomultiplier or a low-light camera; one used calcium-selective microelectrodes. These methods do not all report the same thing. A camera can reveal where a wavefront moves. A whole-cell detector can give exquisite timing while averaging away geography. An electrode measures near its tip. Calibration, saturation, injection, optical sampling and cell preparation limit every number.
That is why the two panels below belong together. The egg cross-section asks where has the signal reached? The graph asks when did calcium rise, how long did it remain high, and did it return? Neither is a film of calcium itself. Brightness is an encoded measurement, and this atlas goes one step further: it reconstructs deterministic schematic curves from published summaries rather than reproducing raw recordings.
One message, several temporal dialects
Choose a species, play its pattern, then switch between Actual time and Normalized replay. Actual time preserves the stated biological units. Normalized replay deliberately places a seconds-long wave and an hour-long train on the same 0–100% viewing scale; it compares pattern shapes, not mechanisms or rates. Open the source drawer or move through the evidence table before treating any visual feature as a measurement.
Fertilization calcium atlas
One message, several temporal dialects
Follow a literature-anchored calcium signal through an egg, then compare a single wave, a slow train, and rapid pulses without pretending they share one clock.
Accelerated replay ×233; the axis and readout retain biological time.
Spatial view
Inside the egg
Brightness is schematic; no measured propagating front is claimed for this profile.
Temporal view
Relative cytosolic calcium
The line is deterministic visual interpolation. Exact measured concentrations, intervals, methods, samples, and limits are kept in the evidence card and table below.
Evidence and focus card
Human: what the sources actually report
- Peak calcium
- 2.5 µM reported maximum The paper reports amplitudes up to 2.5 µM; this is not a population mean.
- Interval
- 10–35 min reported range Reported interval between observed transients.
- Transient duration
- 120 s reported Reported transient duration.
- Viewing window
- 1 h 10 min 00 s schematic A 70-minute viewing window chosen to show several pulses.
Method and sample
Method. Aequorin was microinjected and luminescence was measured with a photomultiplier system.
Sample. 11 zona-intact and 15 zona-free IVF oocytes were exposed to sperm; transients were recorded in 3 and 7 respectively.
Limitations
- Historical, small IVF-oocyte study; responses were observed in only a subset of exposed oocytes.
- The 2.5 µM value is a reported maximum, not an average.
- Do not read the response subset as a fertilization-success rate.
- The cited experiment did not map a propagating human wave; the egg panel therefore uses whole-cell schematic brightening.
Open source drawer for Human
- Taylor et al. (1993) reported
Method: Aequorin was microinjected and luminescence was measured with a photomultiplier system.
Sample: 11 zona-intact and 15 zona-free IVF oocytes were exposed to sperm; transients were recorded in 3 and 7 respectively.
Note: Reported transient duration.
- Atlas method note schematic
Note: Pulse widths follow the reported 120-second summary; pulse placement within the reported 10–35-minute interval range is illustrative.
Orientation only · not to scale
A compact downstream sequence
- 1calcium signal
- 2cortical reaction
- 3meiotic completion
- 4pronuclei
- 5first mitosis
The order is a compact mammalian orientation strip. Exact timing, blocks to polyspermy, and cell-cycle details vary across species; this strip is not generated from the trace above.
Text and table alternative
The evidence without animation
| Species | Pattern | Reported or derived values | Method and boundary | Source |
|---|---|---|---|---|
| HumanHomo sapiens | slow train | Peak calcium: 2.5 µM (reported maximum); Interval: 10–35 min (reported range); Transient duration: 120 s (reported) | Aequorin was microinjected and luminescence was measured with a photomultiplier system. Historical, small IVF-oocyte study; responses were observed in only a subset of exposed oocytes. | |
| MouseMus musculus | slow train | Interval: 11.5 min (derived); First wave crossing: 4–5 s (reported range); Wave speed: 20 µm/s (reported); Later wave speed: 80–100 µm/s (reported range); Late frequency: 5.2 ± 0.3 spikes/h (reported); Spatial replay crossing: ≈4.5 s (schematic); Later spatial replay crossing: ≈1 s (schematic) | The cadence and propagation summaries come from two separate mouse experiments: calcium recording and high-speed imaging. The frequency and wave-speed measurements come from separate experiments and are not one raw trace. | |
| Golden hamsterMesocricetus auratus | repeated responses · first event shown | Transient duration: 12–17 s (reported range); First-response onset: 10–30 s (reported range); First wave crossing: 4–7 s (reported range); Later wave crossing: ≈2 s (reported); Spatial replay crossing: ≈5.5 s (schematic) | Aequorin luminescence imaged with a supersensitive television camera. The actual-time chart encodes only the first response; the source reports later waves but does not provide a recurrence interval to encode here. | |
| FrogXenopus laevis | single event | Resting calcium: 0.4 µM (reported); Peak calcium: 1.2 µM (reported); Calcium rise: ≈120 s (reported); Recovery after rise: ≈600 s (reported); Wave speed: 9.7 µm/s (reported); Spatial replay crossing: ≈114 s (schematic) | Calcium-selective microelectrodes, including paired electrodes for propagation. This is the counterexample to “all fertilized eggs oscillate”: no further calcium changes were detected through first cleavage. | |
| Ascidian — PhallusiaPhallusia mammillata | rapid pulses | Resting calcium: 0.09 µM (reported); Peak calcium: 7 µM (reported); Later pulse peaks: 1–4 µM (reported range); Interval: 1–3 min (reported range); Transient duration: 120–180 s (reported range); Later pulse count: 12–25 pulses (reported range); Signal stops: ≈25 min (reported) | Injected aequorin with single-egg chemiluminescence recording. Phallusia and Ciona initial peaks are kept separate; only the shared reported later-pulse range is repeated. | |
| Ascidian — CionaCiona intestinalis | rapid pulses | Resting calcium: 0.09 µM (reported); Peak calcium: 10 µM (reported); Later pulse peaks: 1–4 µM (reported range); Interval: 1–3 min (reported range); Transient duration: 120–180 s (reported range); Later pulse count: 12–25 pulses (reported range); Signal stops: ≈25 min (reported) | Injected aequorin with single-egg chemiluminescence recording. Ciona is not averaged with Phallusia: its approximately 10 µM initial peak remains separate. | |
| Sea urchinLytechinus pictus | single event | Wave speed: 5 µm/s (reported); Spatial replay crossing: ≈18 s (schematic) | Injected aequorin recorded with an imaging photon detector. The source reports propagation speed but no calcium amplitude used by this atlas. |
Human profile selected.
Uses the speech voice supplied by your browser or device.
There is no universal fertilization waveform. In the historical human IVF-oocyte study by Taylor and colleagues, responding oocytes produced roughly two-minute transients separated by 10–35 minutes, with amplitudes reported up to 2.5 micromolar. That value is a maximum, not a mean; responses appeared in only ten of 26 sperm-exposed oocytes across two manipulated groups, so the fraction is not a fertilization-success rate. The experiment measured aequorin luminescence but did not map a human spatial wave. The atlas therefore lets the human egg brighten as an explicitly schematic whole-cell display.
Mouse studies supply a different pair of views. Faure and colleagues reported 5.2 ± 0.3 late spikes per hour in 55 monospermic, zona-free eggs. Dividing 60 minutes by the group mean gives about 11.5 minutes per spike, but that reciprocal is a derived convenience, not a directly measured mean interval. In a separate imaging experiment, Deguchi and colleagues described the first wave at about 20 micrometres per second in most eggs and later waves at 80–100 micrometres per second or more. The atlas synchronises those separate summaries for explanation without pretending they came from one trace.
The contrasts are larger across phyla. A golden-hamster response began 10–30 seconds after observed sperm attachment and crossed the zona-free egg in four to seven seconds; Miyazaki and colleagues described faster later crossings but no recurrence interval to plot. In Xenopus laevis, calcium-selective electrodes recorded a single rise from about 0.4 to 1.2 micromolar over roughly two minutes, recovery over about ten more, and an inferred propagation speed of 9.7 ± 1.5 micrometres per second in four wave-speed experiments (Busa and Nuccitelli, 1985). That single event is a useful refusal of the claim that every fertilized egg oscillates.
Ascidians speak faster. Speksnijder and colleagues found a resting concentration around 90 nanomolar in both species, then an initial peak of about 7 micromolar in Phallusia mammillata and 10 micromolar in Ciona intestinalis. The subsequent shared summary was 12–25 shorter pulses, approximately one to three minutes apart, during meiotic completion. The initial peaks are kept separate because the paper keeps them separate; its public summary pools the later range. The sea urchin Lytechinus pictus adds another single-wave example: aequorin imaging put the wavefront near five micrometres per second (Swann and Whitaker, 1986). Its amplitude is deliberately absent here because local and whole-egg values in that study were different spatial summaries with large absolute uncertainty.
The shared message is not a shared metronome. A single sweeping release, a slow mammalian train and an ascidian burst can all carry an egg out of arrest, but their timing belongs to the physiology and measurement context of that species.
How sperm starts the mammalian signal
After the sperm and egg membranes fuse, the sperm introduces phospholipase C zeta, or PLCζ, into the egg cytoplasm. PLCζ acts on a membrane lipid called PIP₂ found on intracellular vesicles, producing the soluble messenger IP₃. IP₃ diffuses to type-1 IP₃ receptors (IP3R1) on the endoplasmic reticulum. Those receptors open and calcium stored inside the ER enters the cytosol.
This chain is not just a tidy review diagram. In mouse eggs, deleting the sperm’s Plcz1 gene abolished normal oscillations after IVF and ICSI in the tested conditions; rescue experiments restored activation, strongly supporting PLCζ as the primary physiological trigger (Hachem et al., 2017). The knockout males were subfertile rather than sterile, and delayed alternative activation occurred rarely, so “primary trigger” is more accurate than “only conceivable route”.
Why does the release recur rather than simply drain the store once? Experiments and modelling by Sanders, Ashley, Moon, Woolley and Swann support a calcium-to-PLCζ-to-IP₃ positive-feedback loop: a rise in calcium can encourage more IP₃ production and regenerative release. That is only part of the cycle. IP3R1 gating and desensitisation, cytosolic clearance, pumping back into the ER, calcium entry across the surface membrane and the changing state of the stores all shape whether another pulse can occur. The precise termination mechanism is still being refined. “Simple negative feedback” is not an adequate explanation.
Calcium here is a messenger, not a brick from which the embryo is built and not a miniature conductor reading a score. Its concentration changes the activity of many calcium-sensitive proteins at once. Timing allows those targets to accumulate, reset or cross thresholds on different schedules.
What the timing accomplishes
The early consequences appear as a sequence, but not as five perfectly isolated switches. Calcium promotes cortical-granule exocytosis near the egg surface. The released material modifies the egg’s surroundings and contributes to blocks against additional sperm; the exact electrical, membrane and extracellular protections vary by species. Calcium-dependent pathways also release the egg from meiotic arrest, support completion of meiosis, permit formation of the maternal and paternal pronuclei, and prepare entry into the first mitotic cell cycle.
Pulse number can matter because downstream processes have different sensitivities and integration times. In experiments on artificially activated mouse eggs, Ducibella and colleagues delivered defined calcium transients and found that activation events began and completed after different numbers of pulses. Those were electropermeabilised, parthenogenetically activated mouse eggs—not human embryos and not an exact imitation of sperm-driven spatial release. The study demonstrates temporal decoding, not a universal pulse-count recipe.
A second mouse study altered the natural pattern after the first few fertilization transients. Prematurely curtailing oscillations or adding 20 artificial pulses did not change the incidence of blastocyst formation in that experiment, yet implantation, postimplantation development and measured gene expression differed between groups (Ozil et al., 2006). This is evidence that pattern perturbations can have consequences in that mouse protocol. It is not evidence that the human values in the atlas predict clinical outcome, nor that every later difference was caused by pulse count alone.
The most defensible claim is modest and powerful: the egg does not merely detect that fertilization happened. Its molecular machinery can respond to the duration, spacing and repetition of the calcium signal.
A clock that stops
A clock is useful only if we say what it times. Fertilization-associated calcium times egg activation. In the mouse observations described by Deguchi and colleagues, the oscillation train changed over several hours and ceased around pronuclear formation. A recent synthesis, published bibliographically as Swann 2025 although its DOI was registered in December 2024, likewise treats mammalian oscillations as a temporary programme coupled to the transition into the one-cell embryo.
It does not tick unchanged through gastrulation. Later embryos contain other periodic and travelling systems: segmentation clocks that help parcel tissue, calcium events in developing organs, ERK signalling waves and mechanical or morphogenetic oscillations. They may share the general mathematics of feedback, excitability and coupled oscillators, but they are not late verses of one proven fertilization master clock.
Calling the fertilization signal a prelude to morphogenesis preserves what is remarkable without turning metaphor into mechanism. Before there is geometry, there is a regulated change of state; before tissues coordinate across space, one large cell coordinates release and recovery across itself.
Fertilization calcium method
This interactive contains no downloaded recordings and makes no runtime request to a paper or dataset. Every displayed numerical measurement carries one of five evidence labels: reported, reported range, reported maximum, derived, or schematic. The first four remain tied to a source, unit, method and available sample description. “Derived” is used for arithmetic such as the mouse reciprocal interval. “Schematic” marks the chosen viewing window, interpolation, pulse shape or spatial display.
The curves are deterministic: the same species and scrubber position always produce the same state. Pulse shapes between reported summaries are visual interpolation, not hidden observations. Actual-time mode keeps each profile’s seconds or minutes; normalized mode rescales progress to 0–100% and never asserts a common timescale. Phallusia and Ciona are separate profiles. Missing amplitudes and recurrence intervals remain missing. The complete table is the non-animated alternative and the source drawer explains which panels combine evidence from separate experiments.
That ledger is part of the argument. Biological images become persuasive very quickly; provenance should move just as fast as the colour.
The fertilized egg has no heartbeat to count and no anatomy to survey. Yet its future has already become temporal: release, recovery, readiness; one wave or many; a signal that does its work and stops. Before the embryo acquired a shape, it acquired a rhythm.
Word Cloud
Related reading
Selected by shared topics and section, with closer publication dates breaking ties.